NARVAL user manual
NARVAL is a web portal for Earth sciences data visualization. It shows several data products, colocated on a map of the Arctic in polar stereographic north projection (EPSG:3413).
Product selection
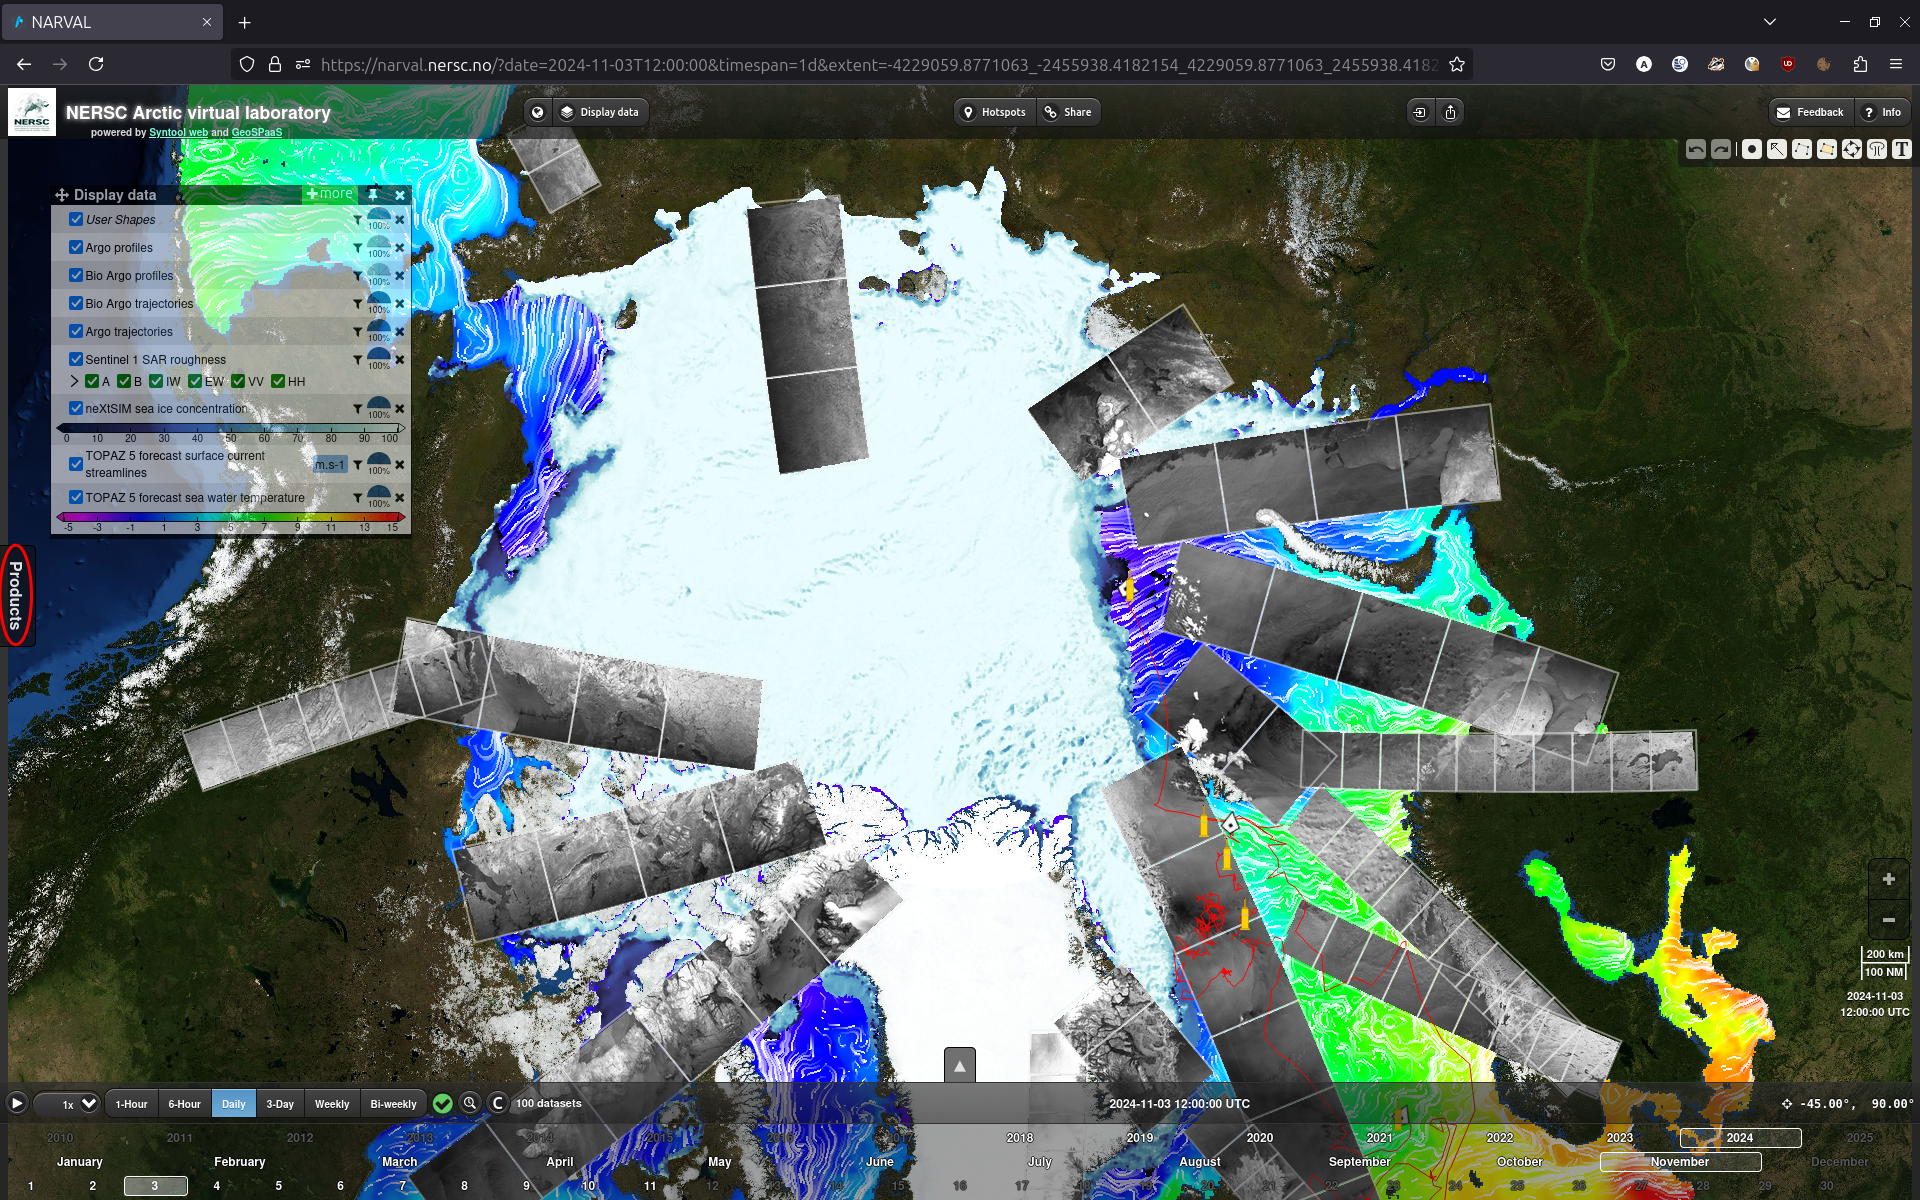
Products menu
On the left side of the screen, you can find a "Products" menu where you can select which products to display.
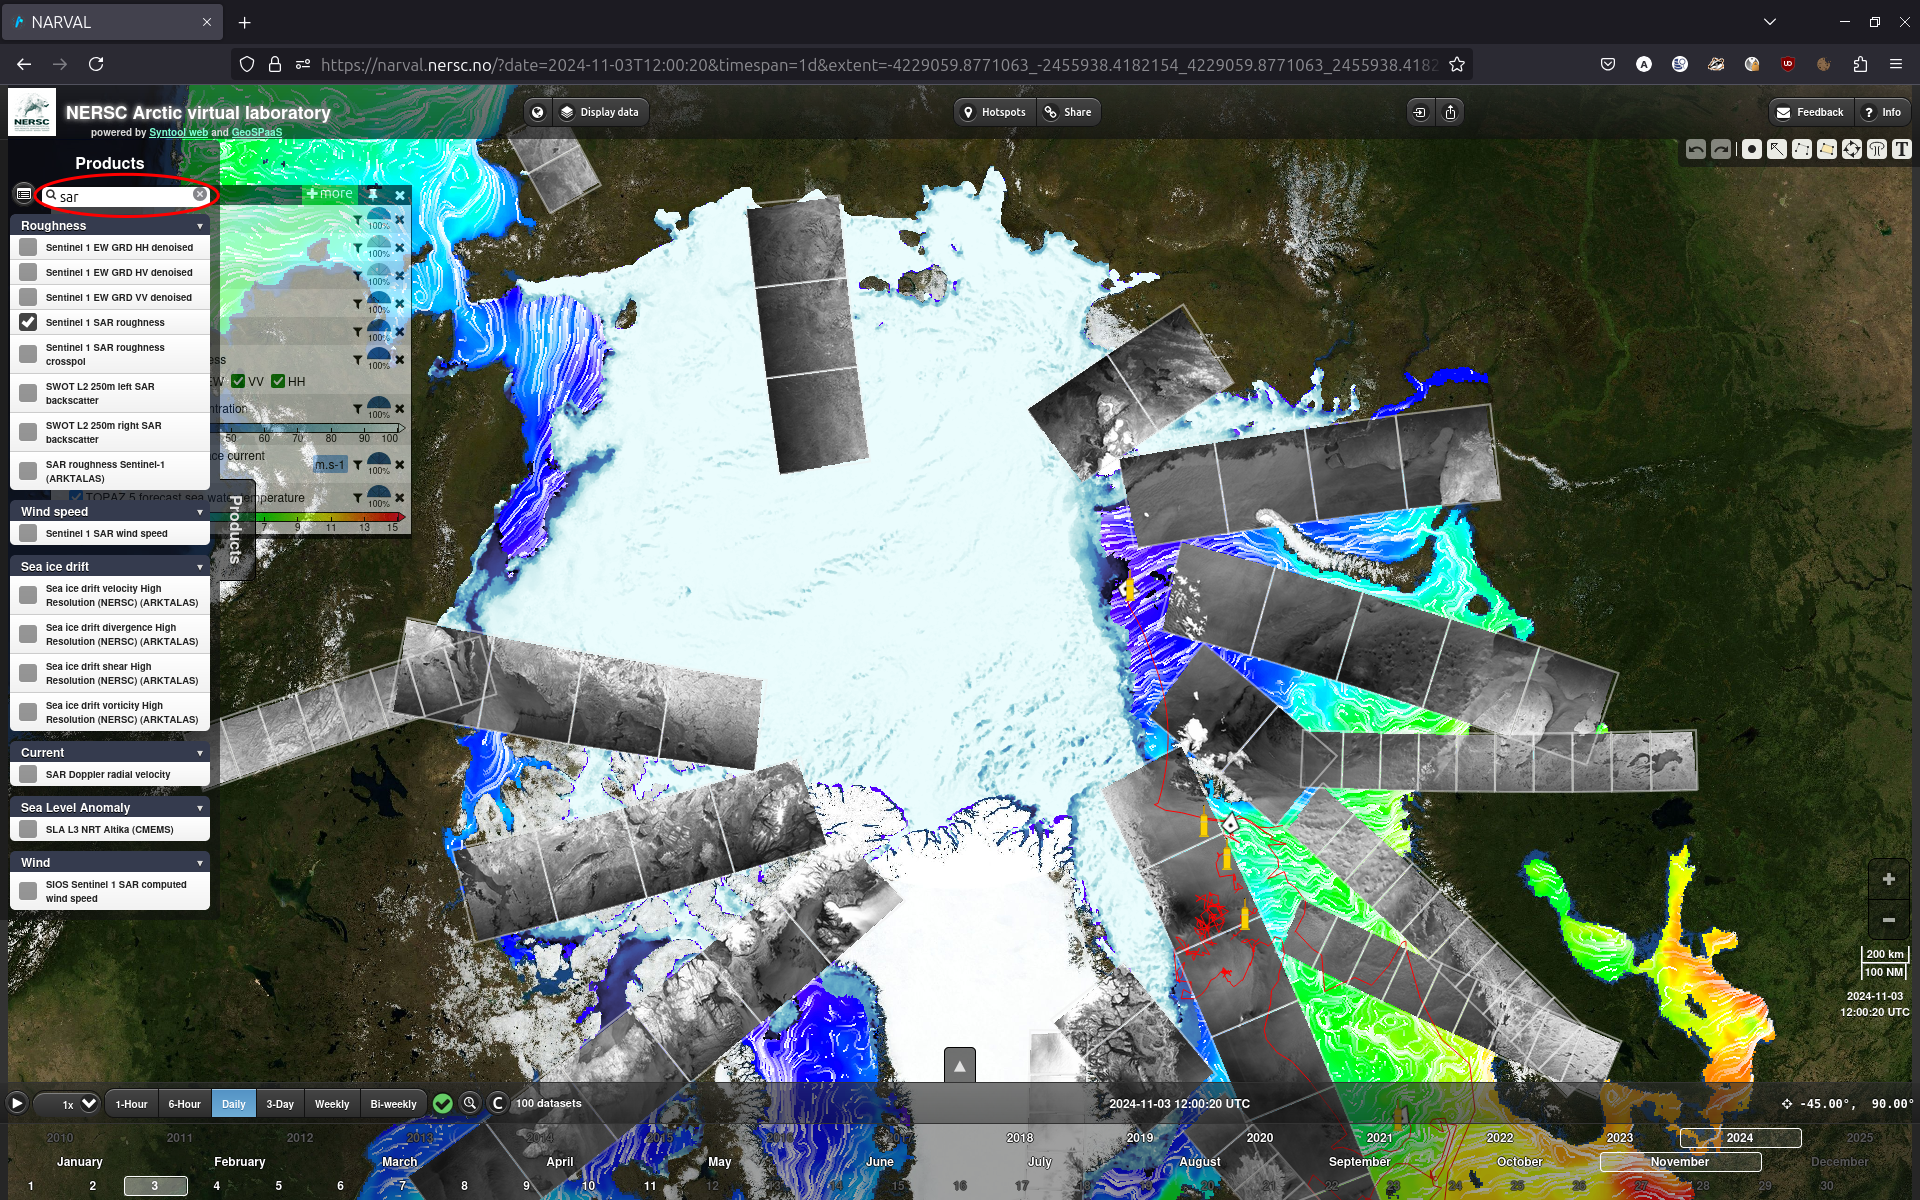
You can type in the search bar to filter the list of products.
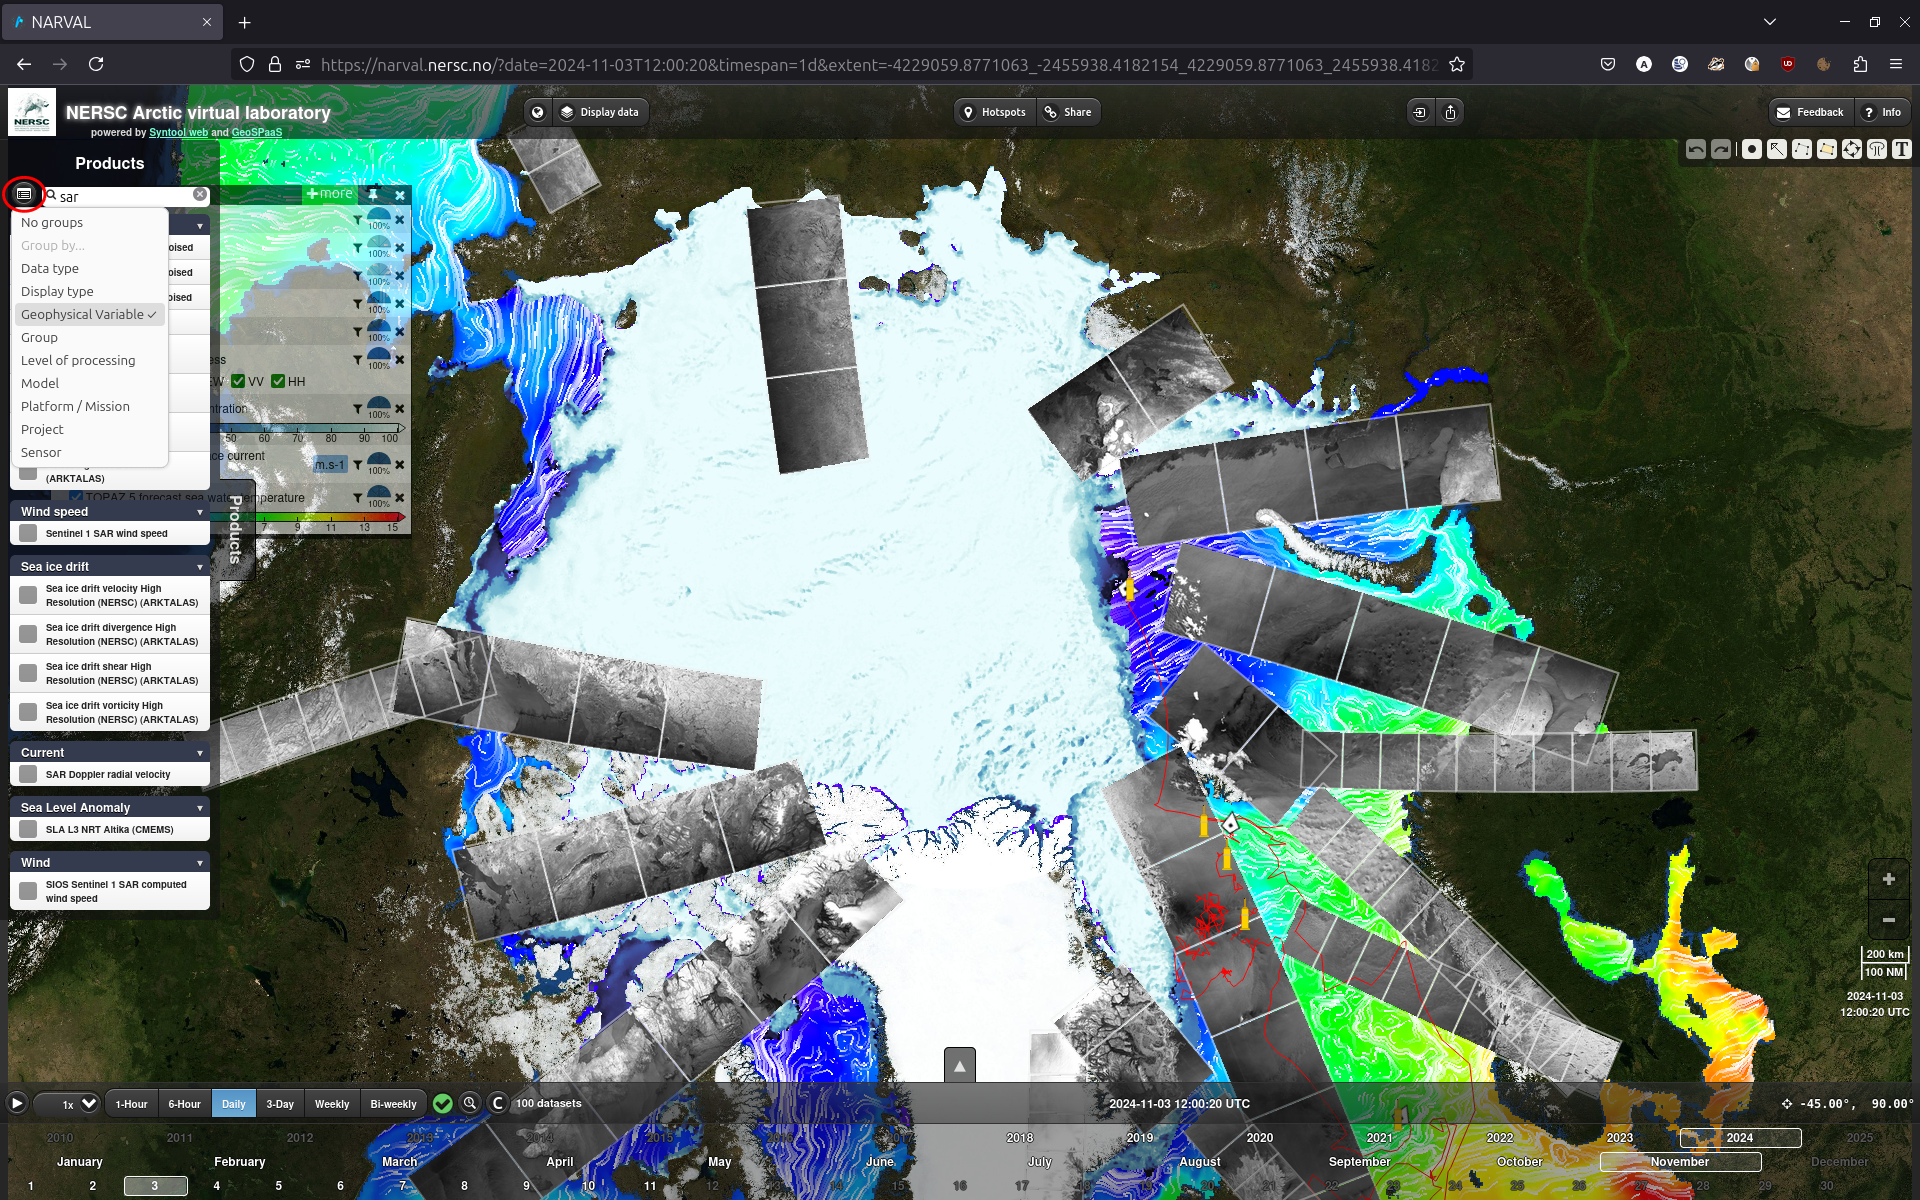
The button on the left of the search bar allows you to sort the list of products according to various criteria including data type, geophysical variable, model/satellite name, etc..
Once a product is selected, it will appear in the "Display data menu".
Display data menu
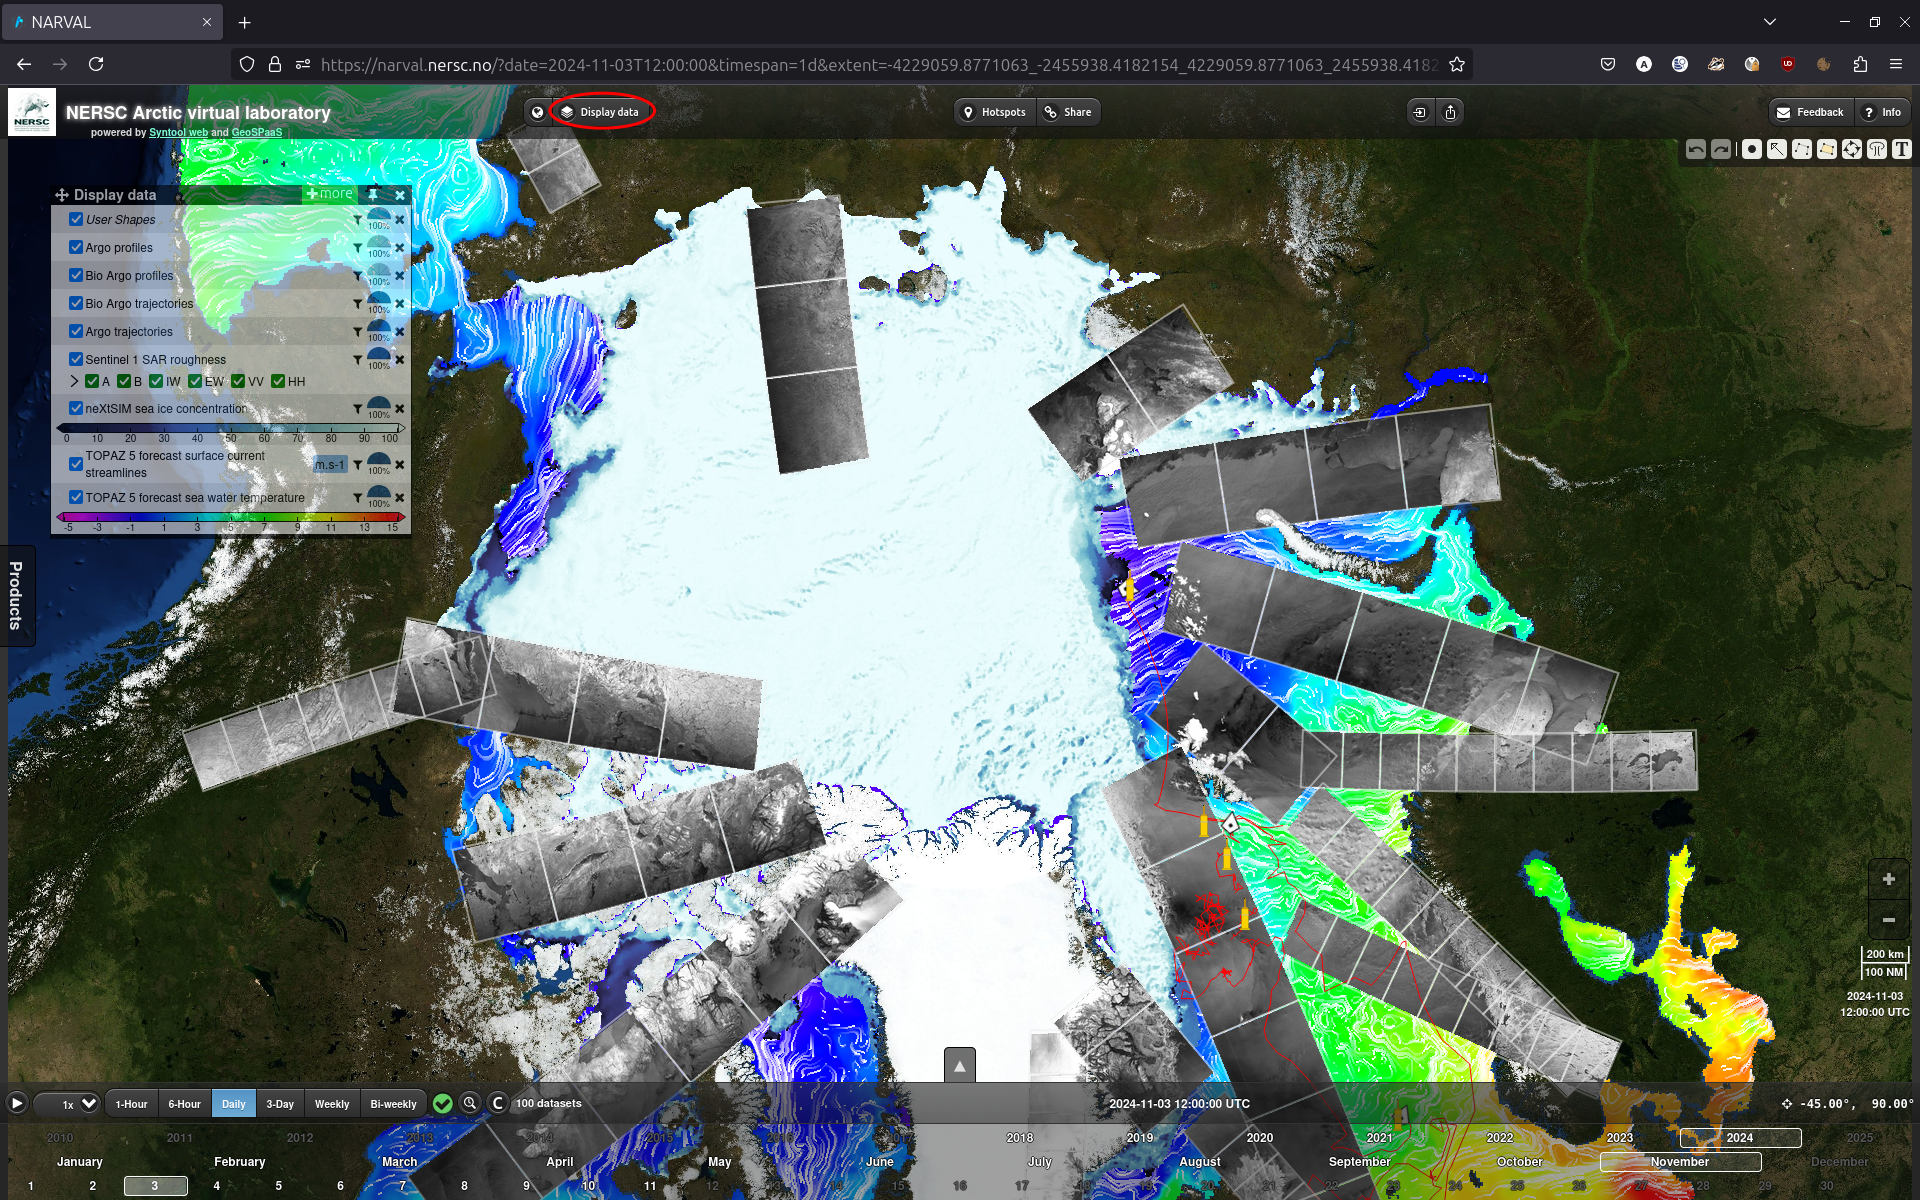
The "Display data" menu allows you to further select which products will appear on the screen as well as configuring how they are displayed.
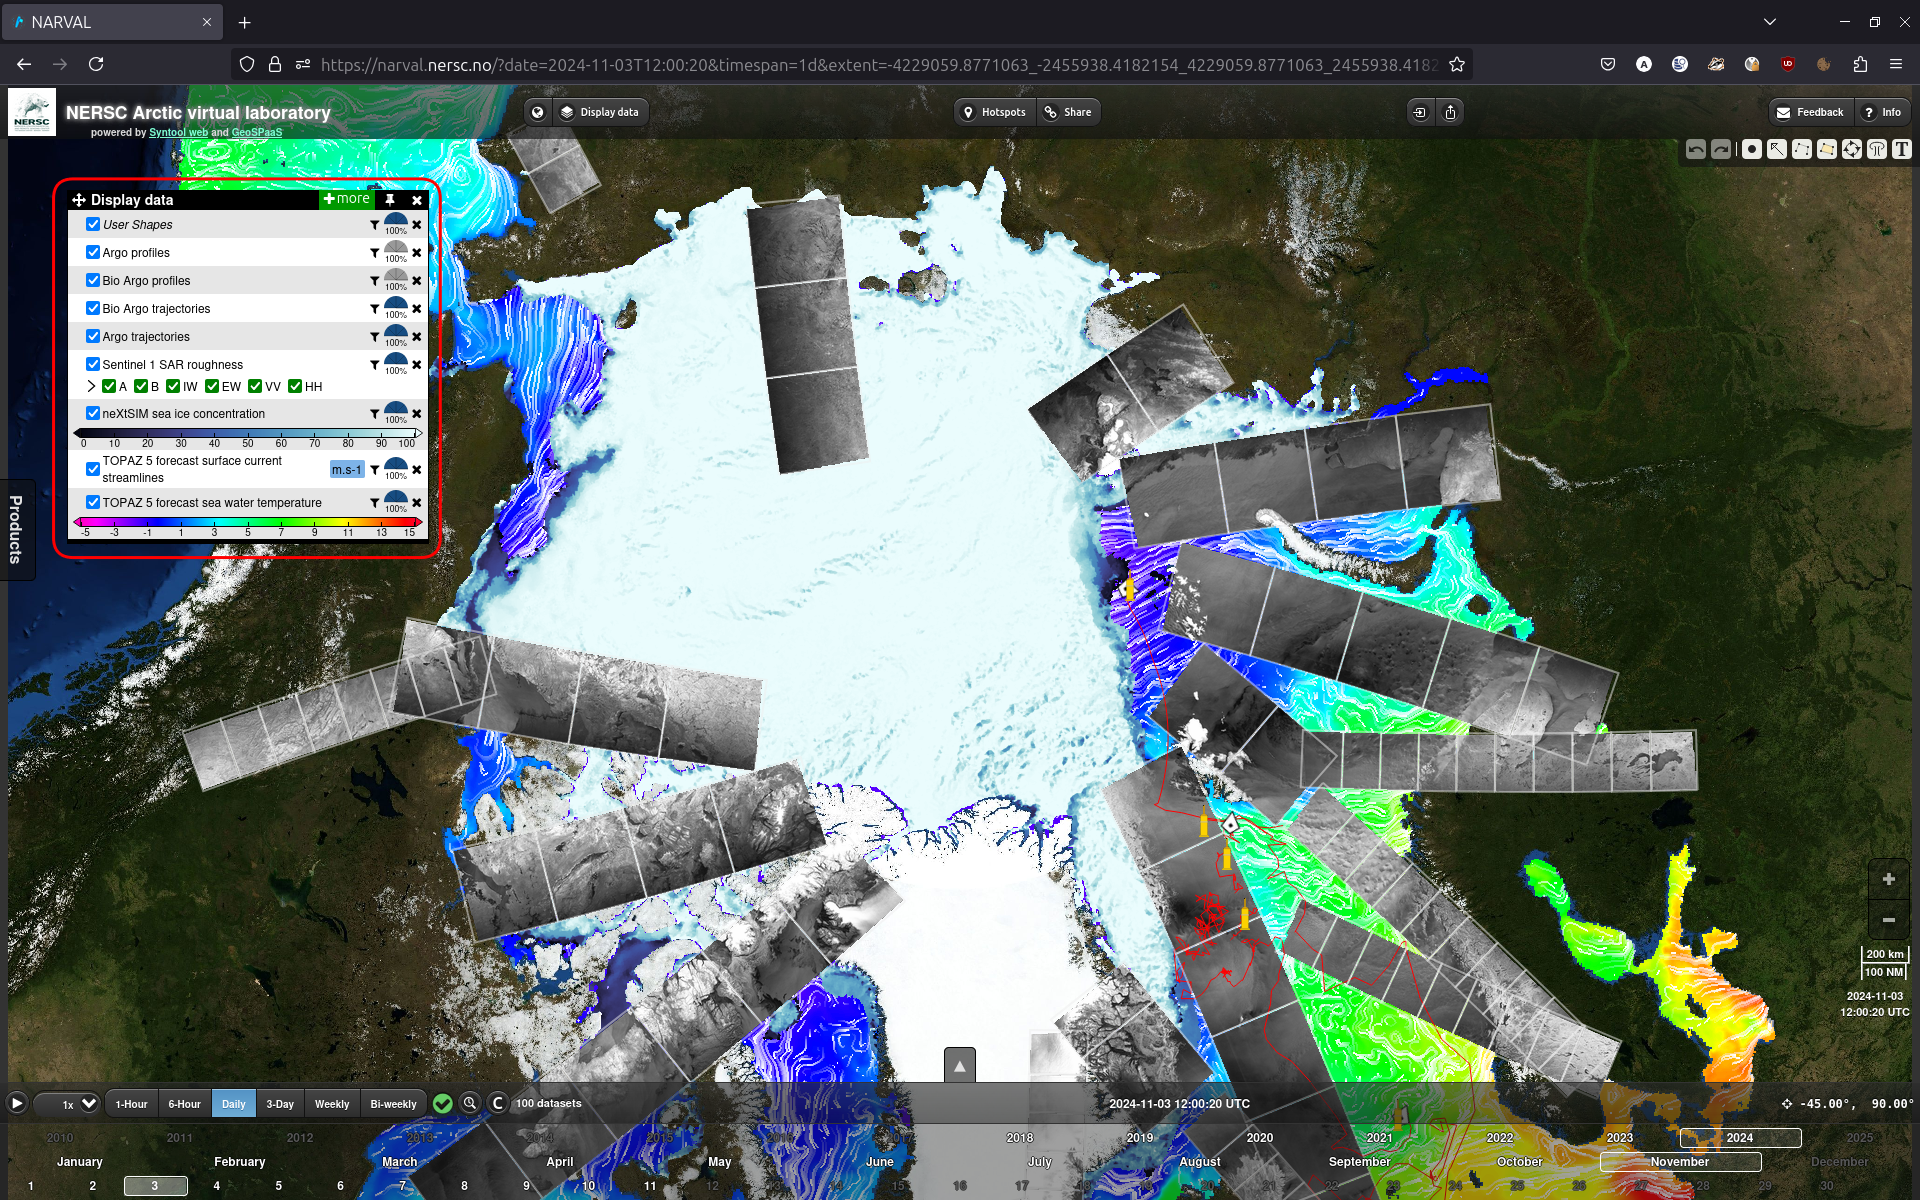
When hovering over a product in the "Display data" window, a double arrow will appear on the left. You can then click and drag that arrow to change the order of the displayed layers.
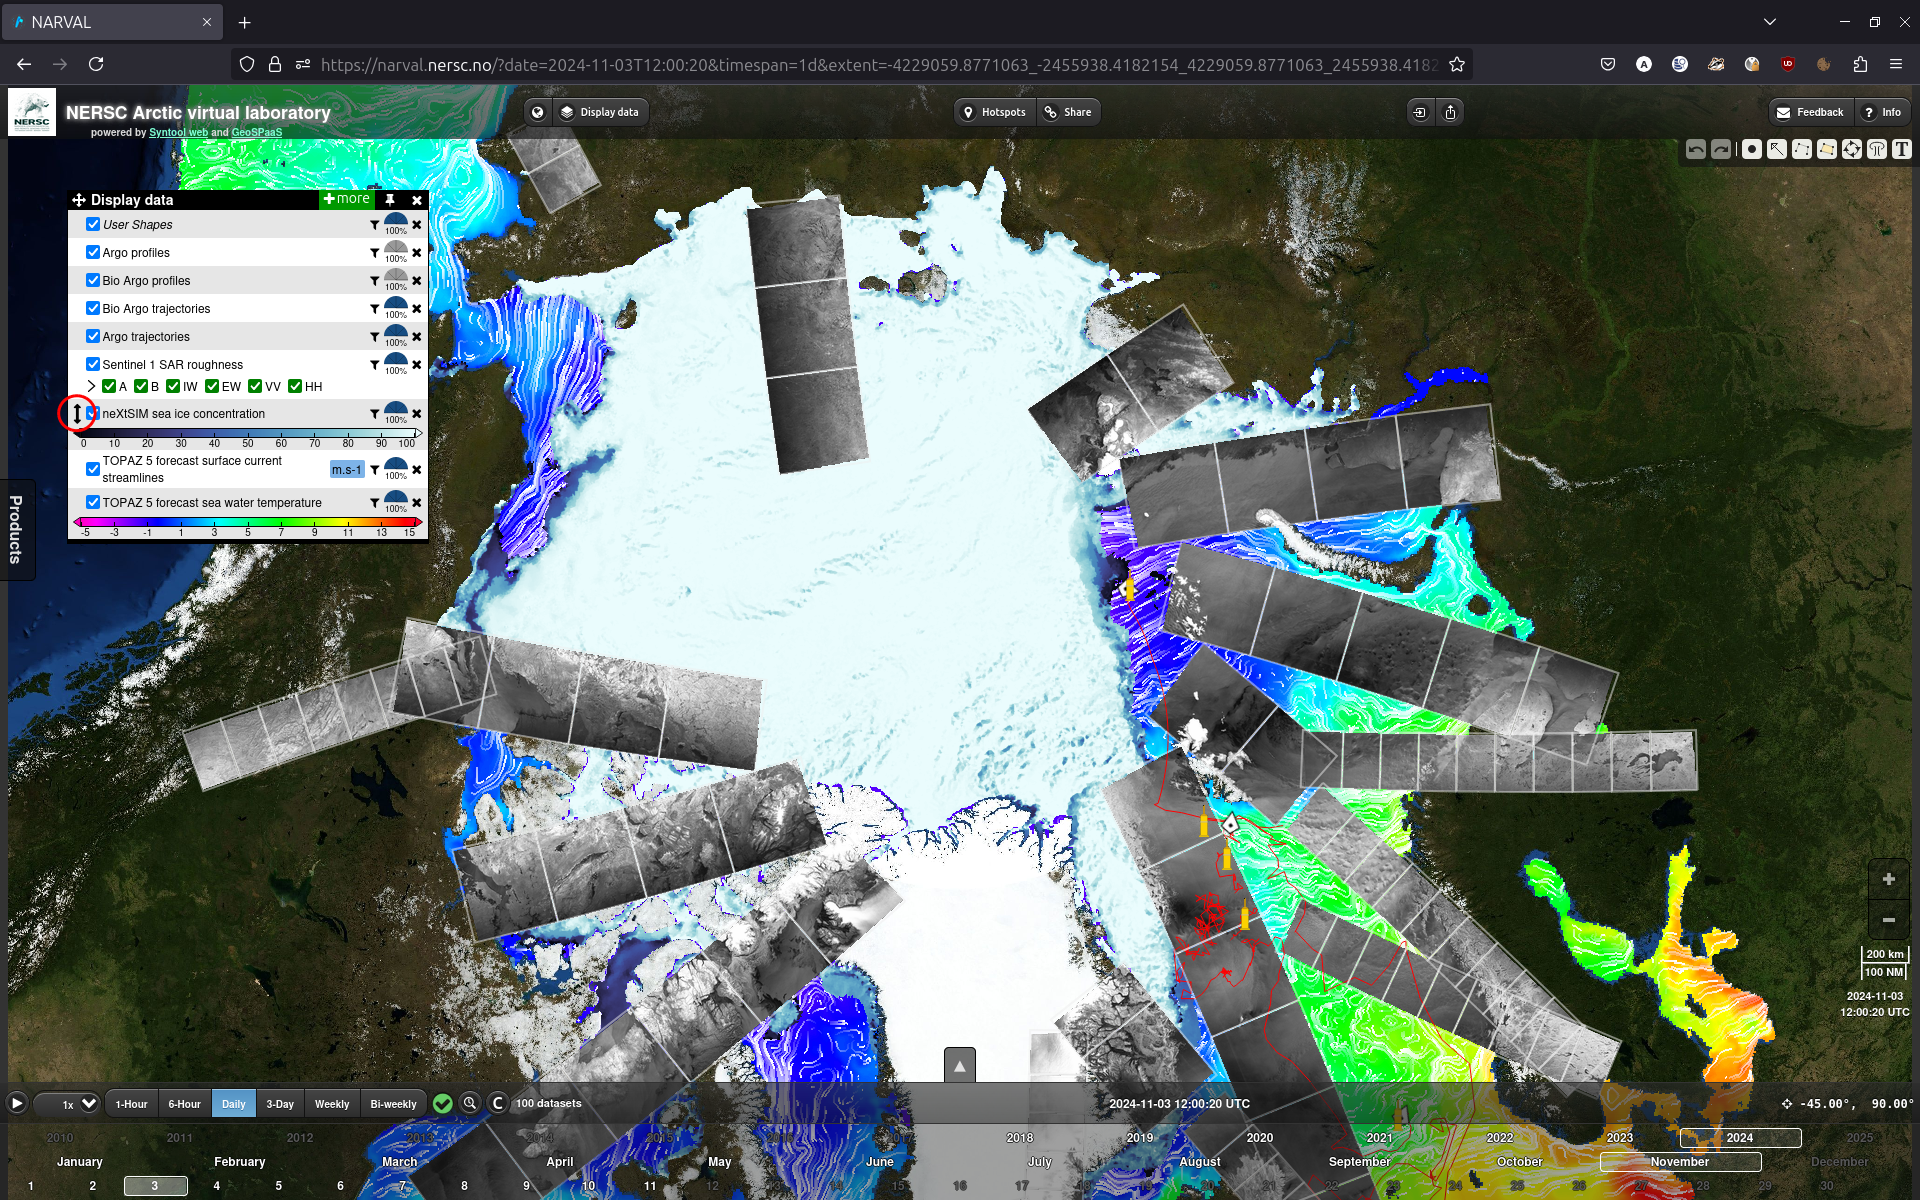
The half-disk on the right of each product row allows you to set the transparency for the corresponding layer. You can directly drag it, or click it to make a bar appear for finer tuning.
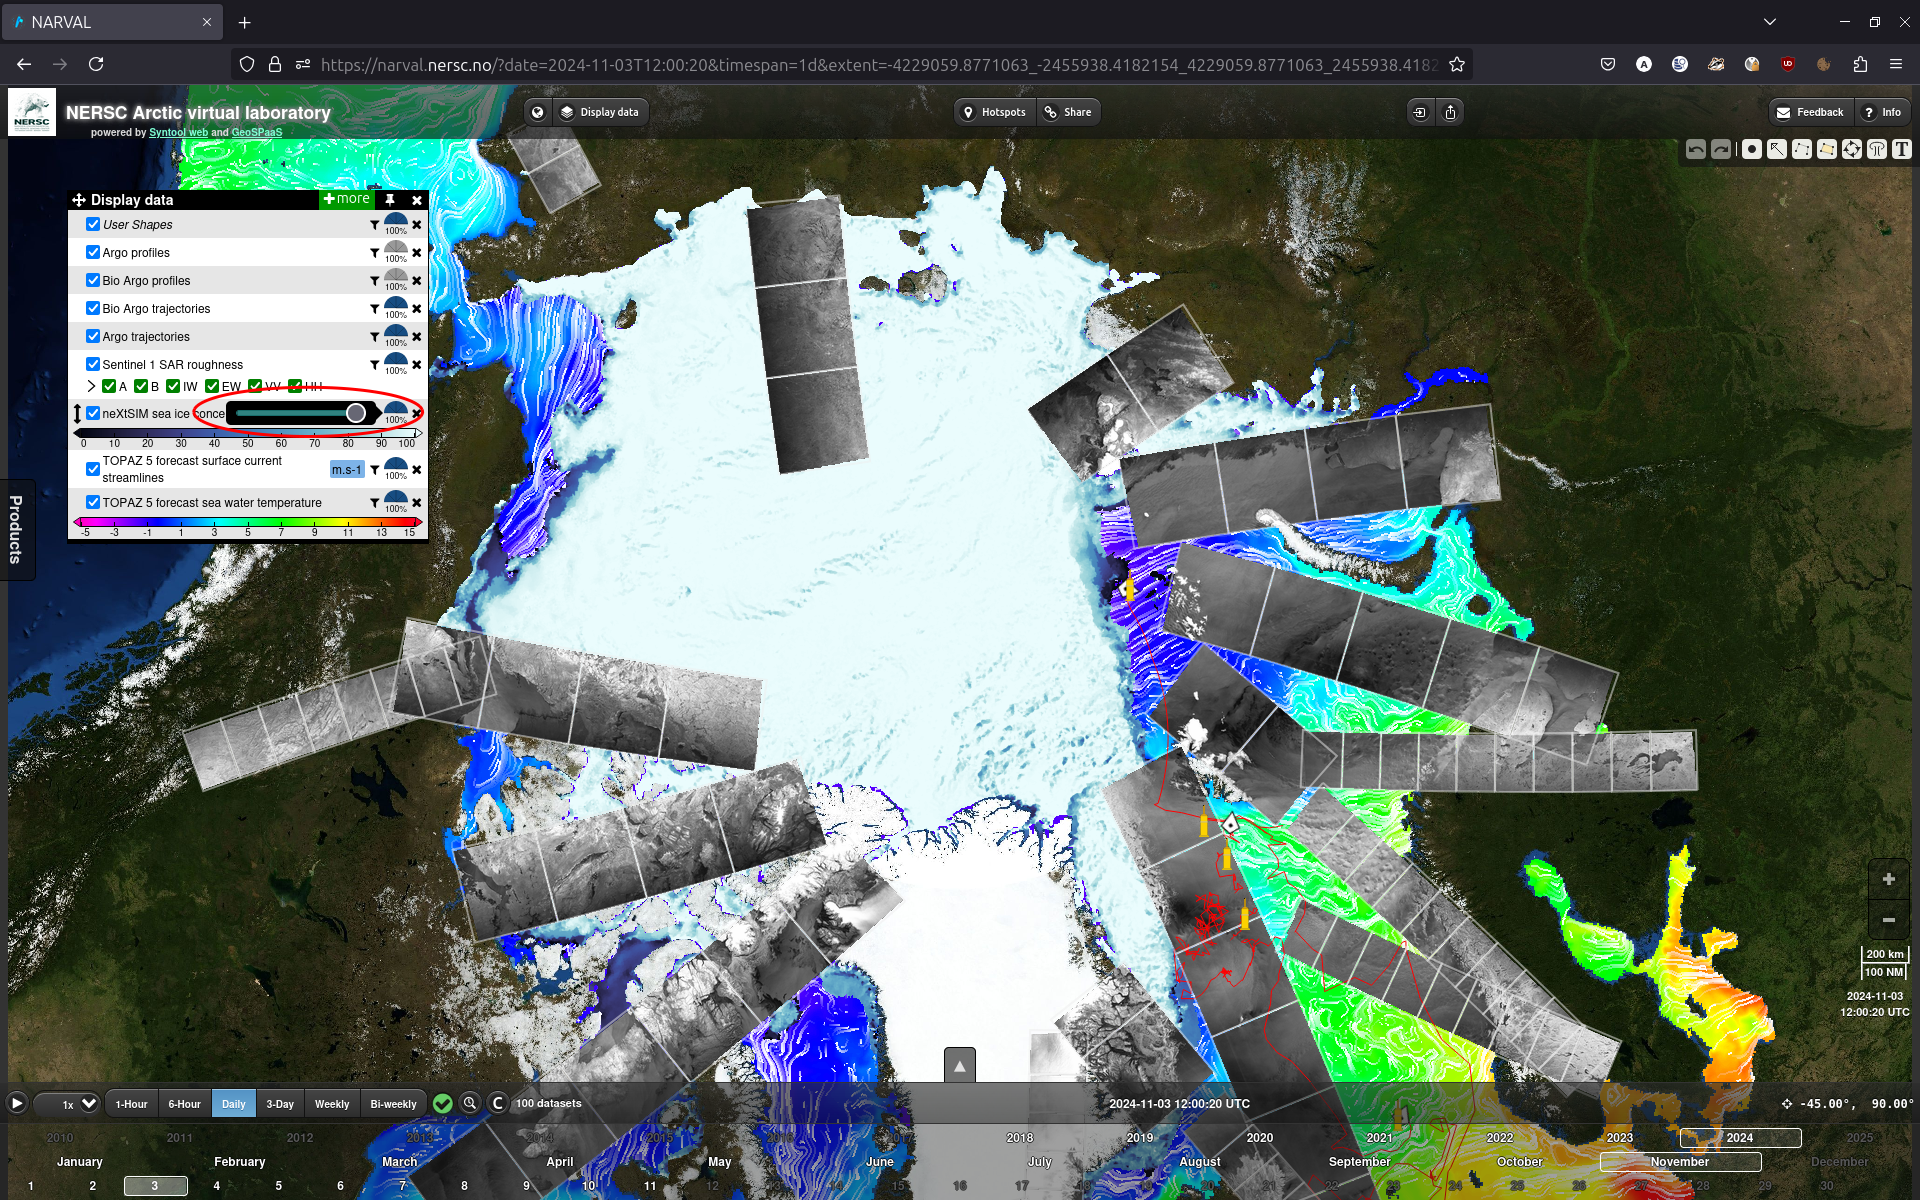
Finally, the cross on the right end of the row allows you to deselect the product.
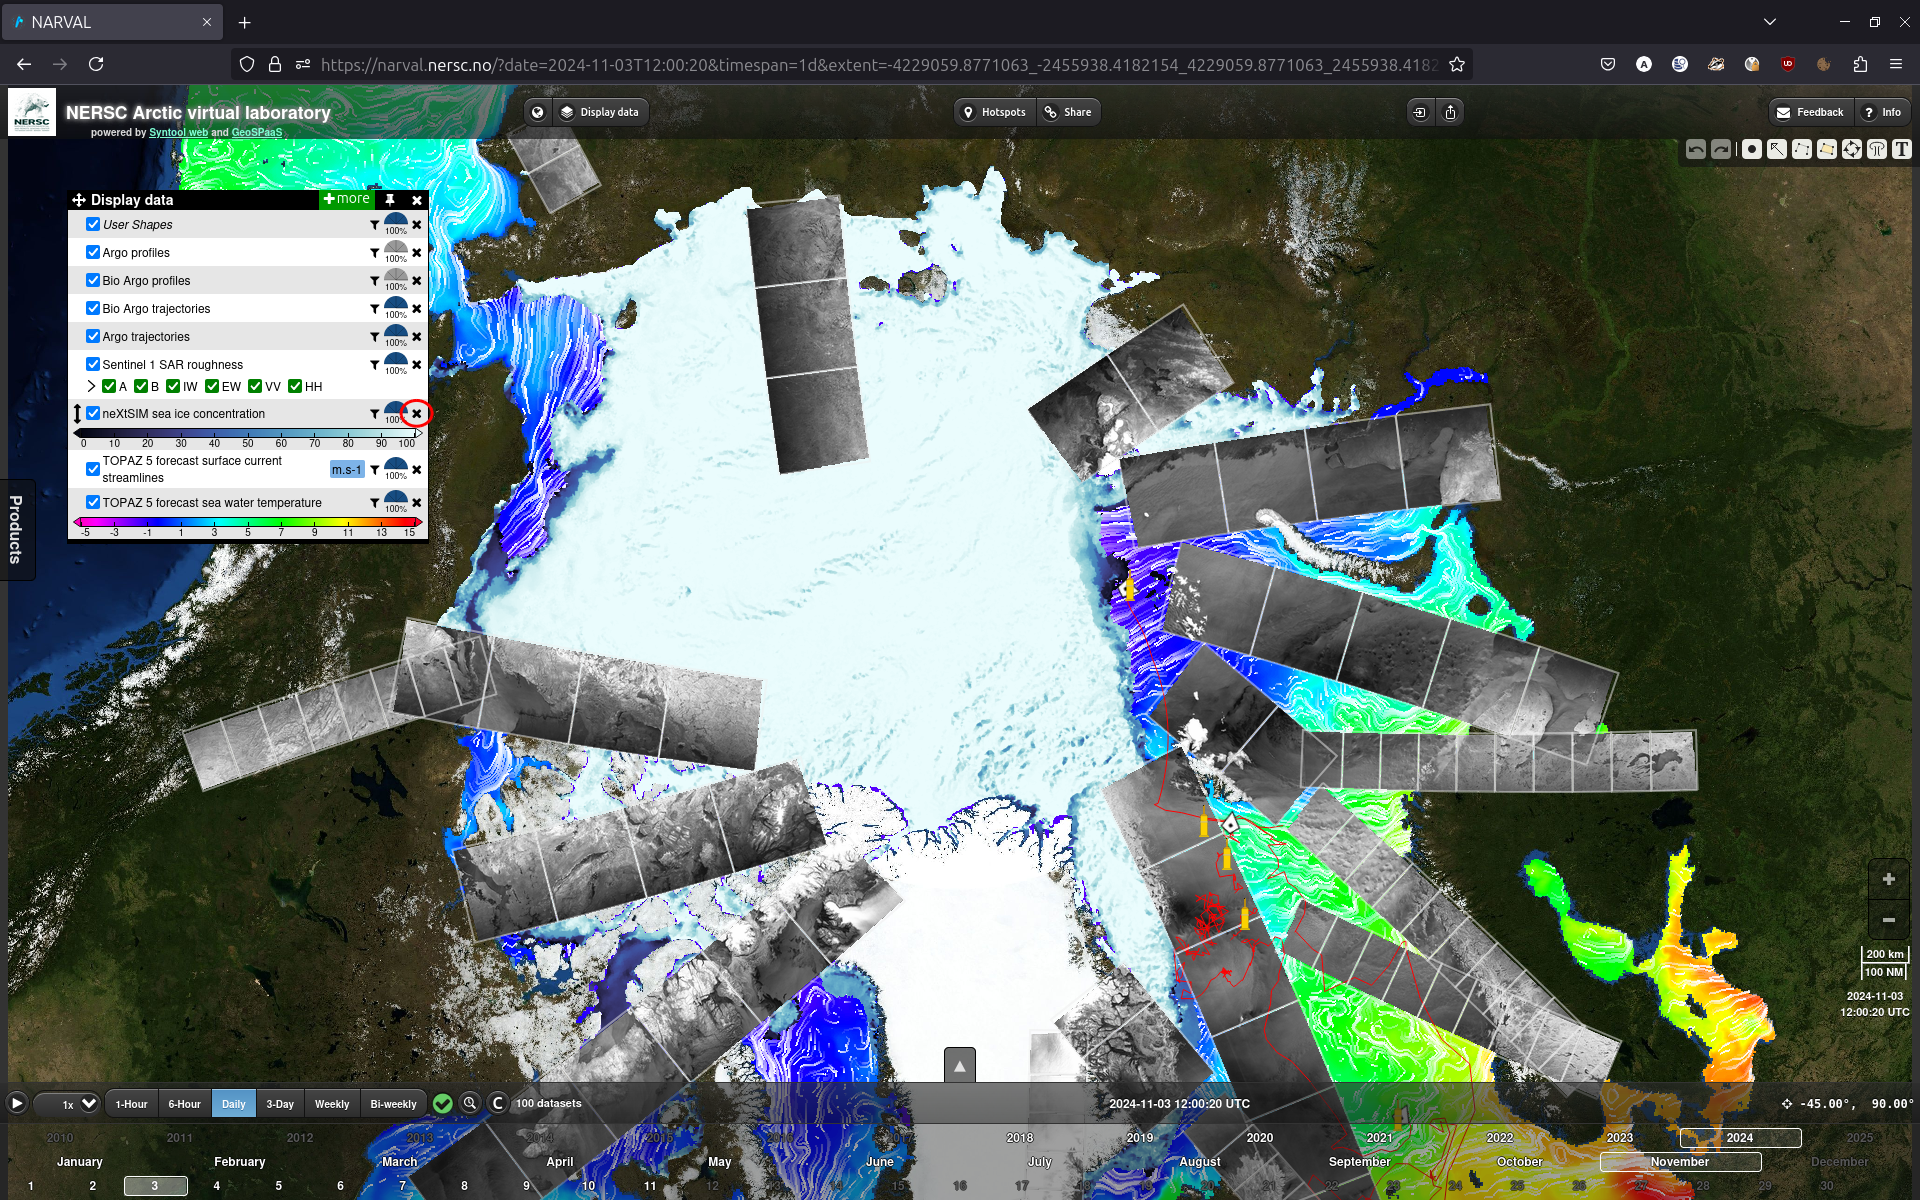
The "Display data" menu can be hidden using the "Display data" button at the top of the screen.
Area selection
The map can be dragged to select the desired area. The zoom level can be adjusted using the +/- buttons at the bottom left of the screen or, depending on the device you are using: - the mouse wheel/finger pinching - double clicking/tapping
Time selection
At the bottom of the screen is the timeline bar. You can select the desired date by clicking on the year, month and day.
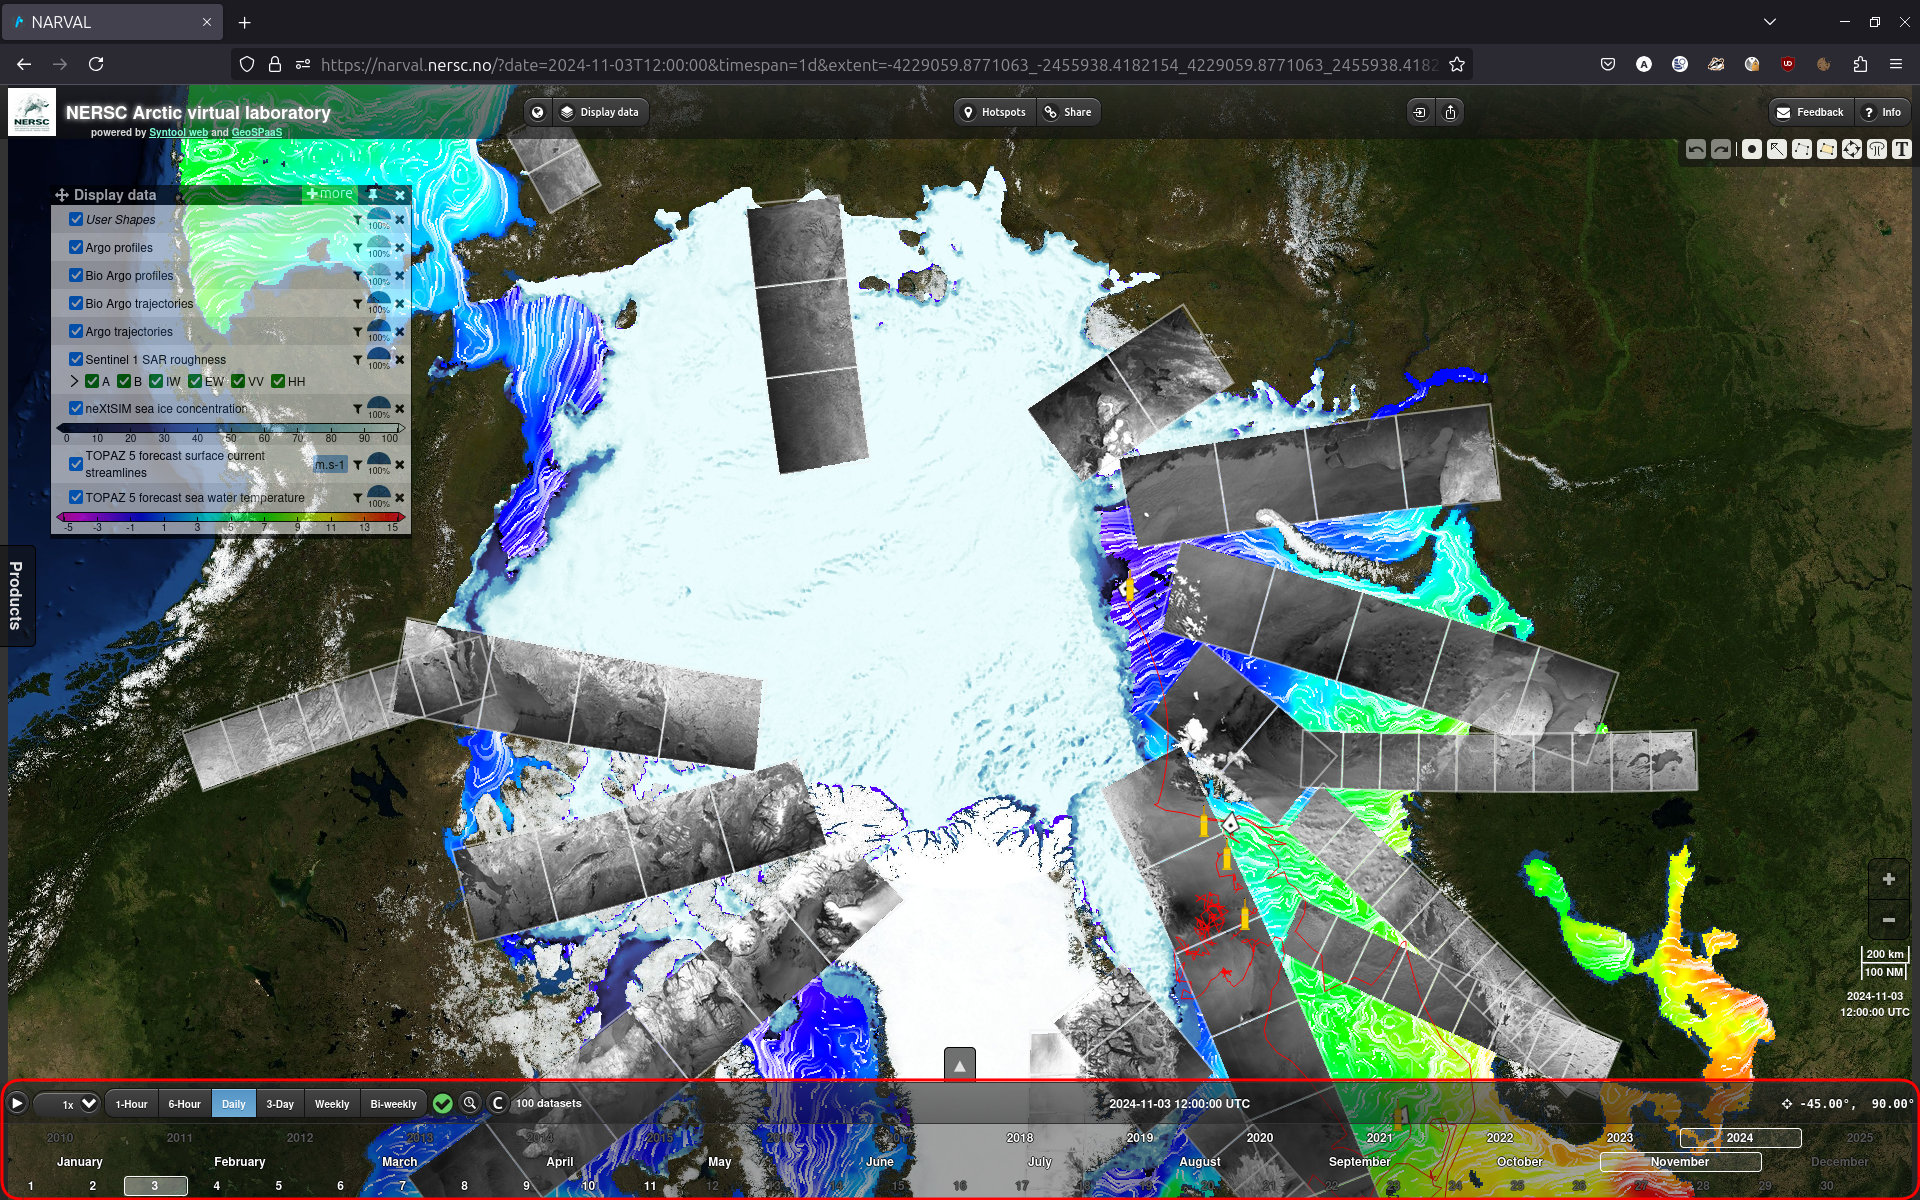
On the top row of the timeline bar, you can find, from left to right:
- The animation controls. Start/stop the animation and adjust the speed
- The timespan selection. The default is "Daily".
- The magnifier button will automatically select the nearest date when at least one dataset is available.
- The colocation button will toggle the coloring of year/month/day cells depending if datasets of all selected products are present or not. See color codes below.
The cells representing the year, month and day are color-coded:
- grey means there are no datasets for the selected products.
- white means that there is at least one dataset.
- yellow (if the colocation toggle is on) means that there are datasets from all selected products, but tno on the same day.
- red (if the colocation toggle is on) means that there are datasets for all selected products on the same day.
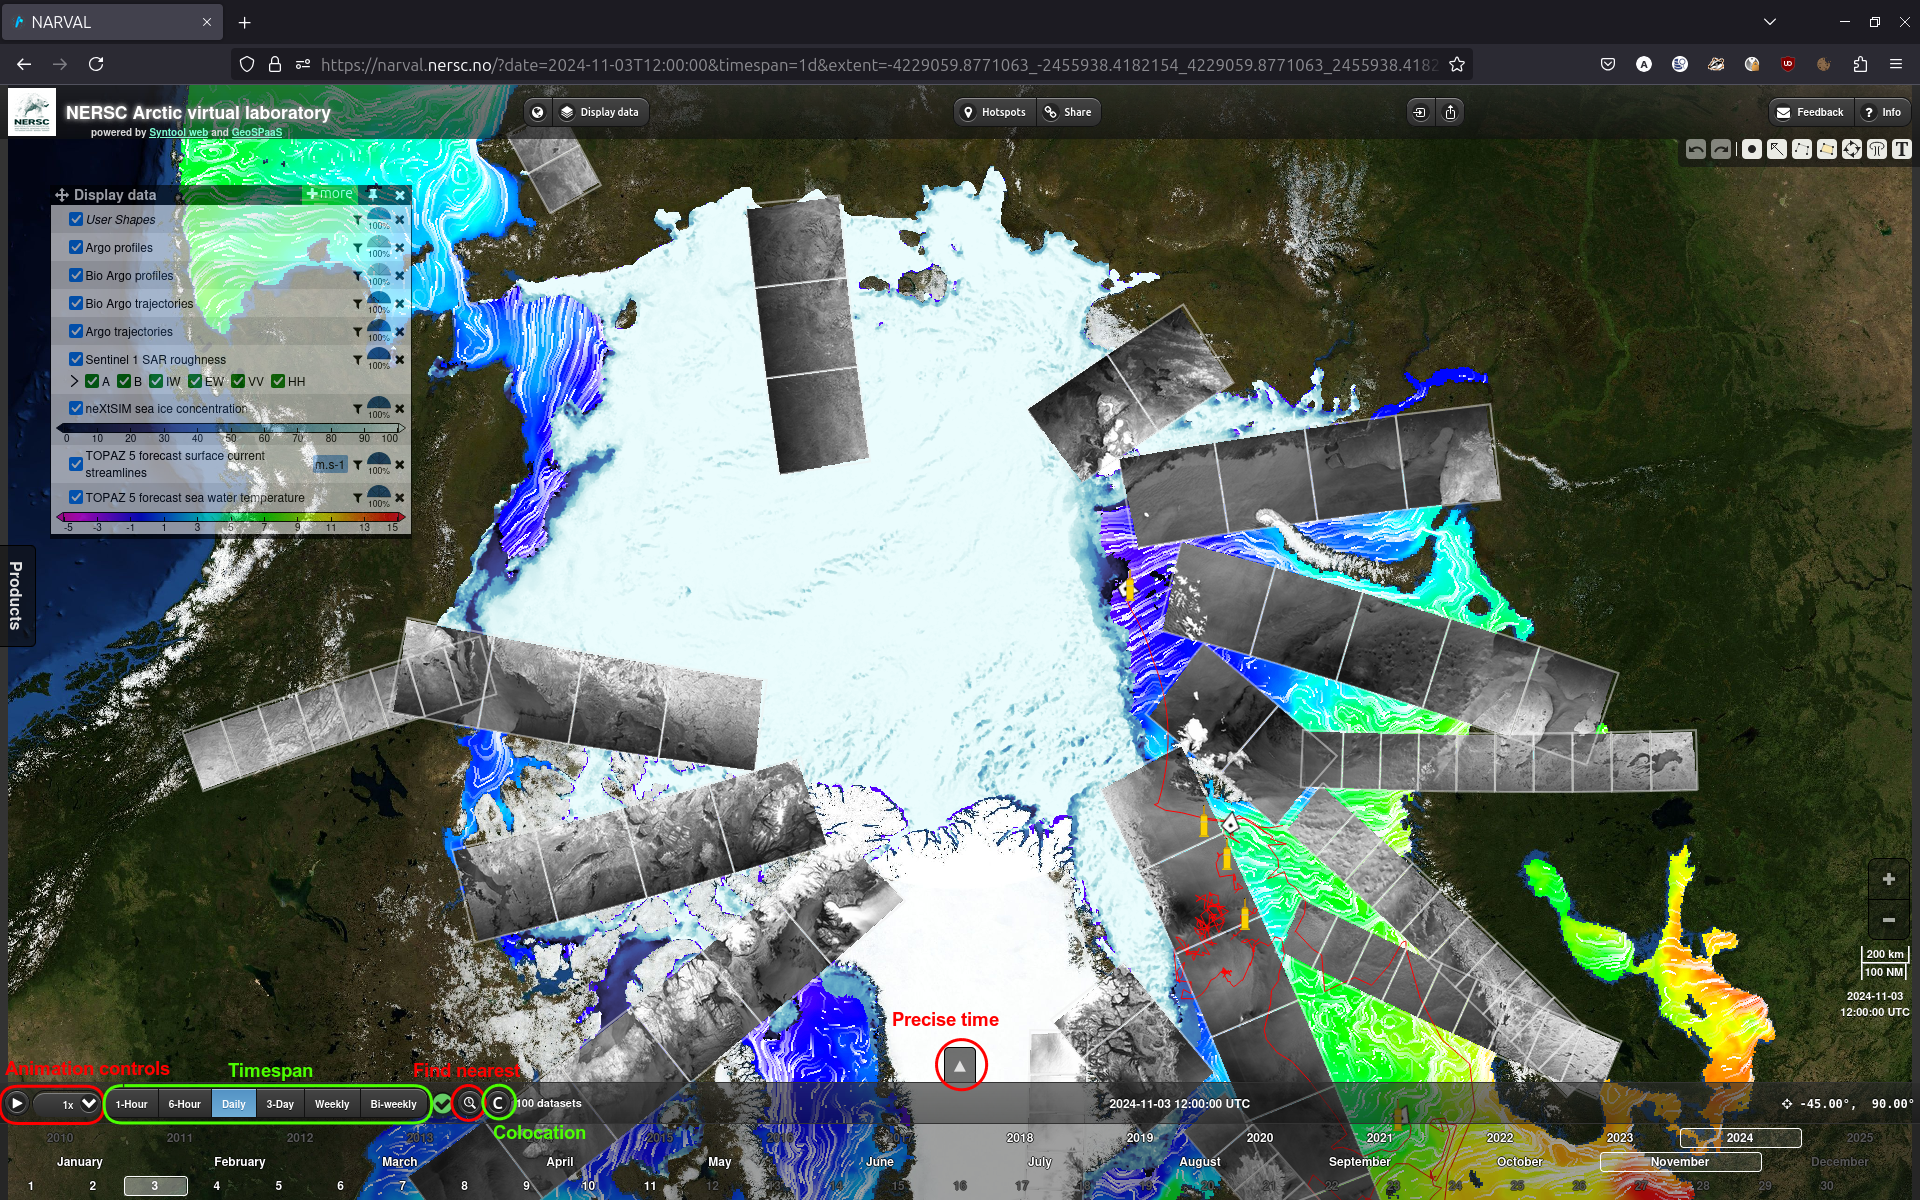
The upwards arrow on the top middle of the timeline bar allows you to pull up a menu for precise time selection. You can drag the new bar to set the time. It also shows the time coverage of the displayed datasets. You can click on the markers to select the corresponding dataset.
Data access
NARVAL displays images generated from the data products. This means that the original data cannot be accessed directly through NARVAL.
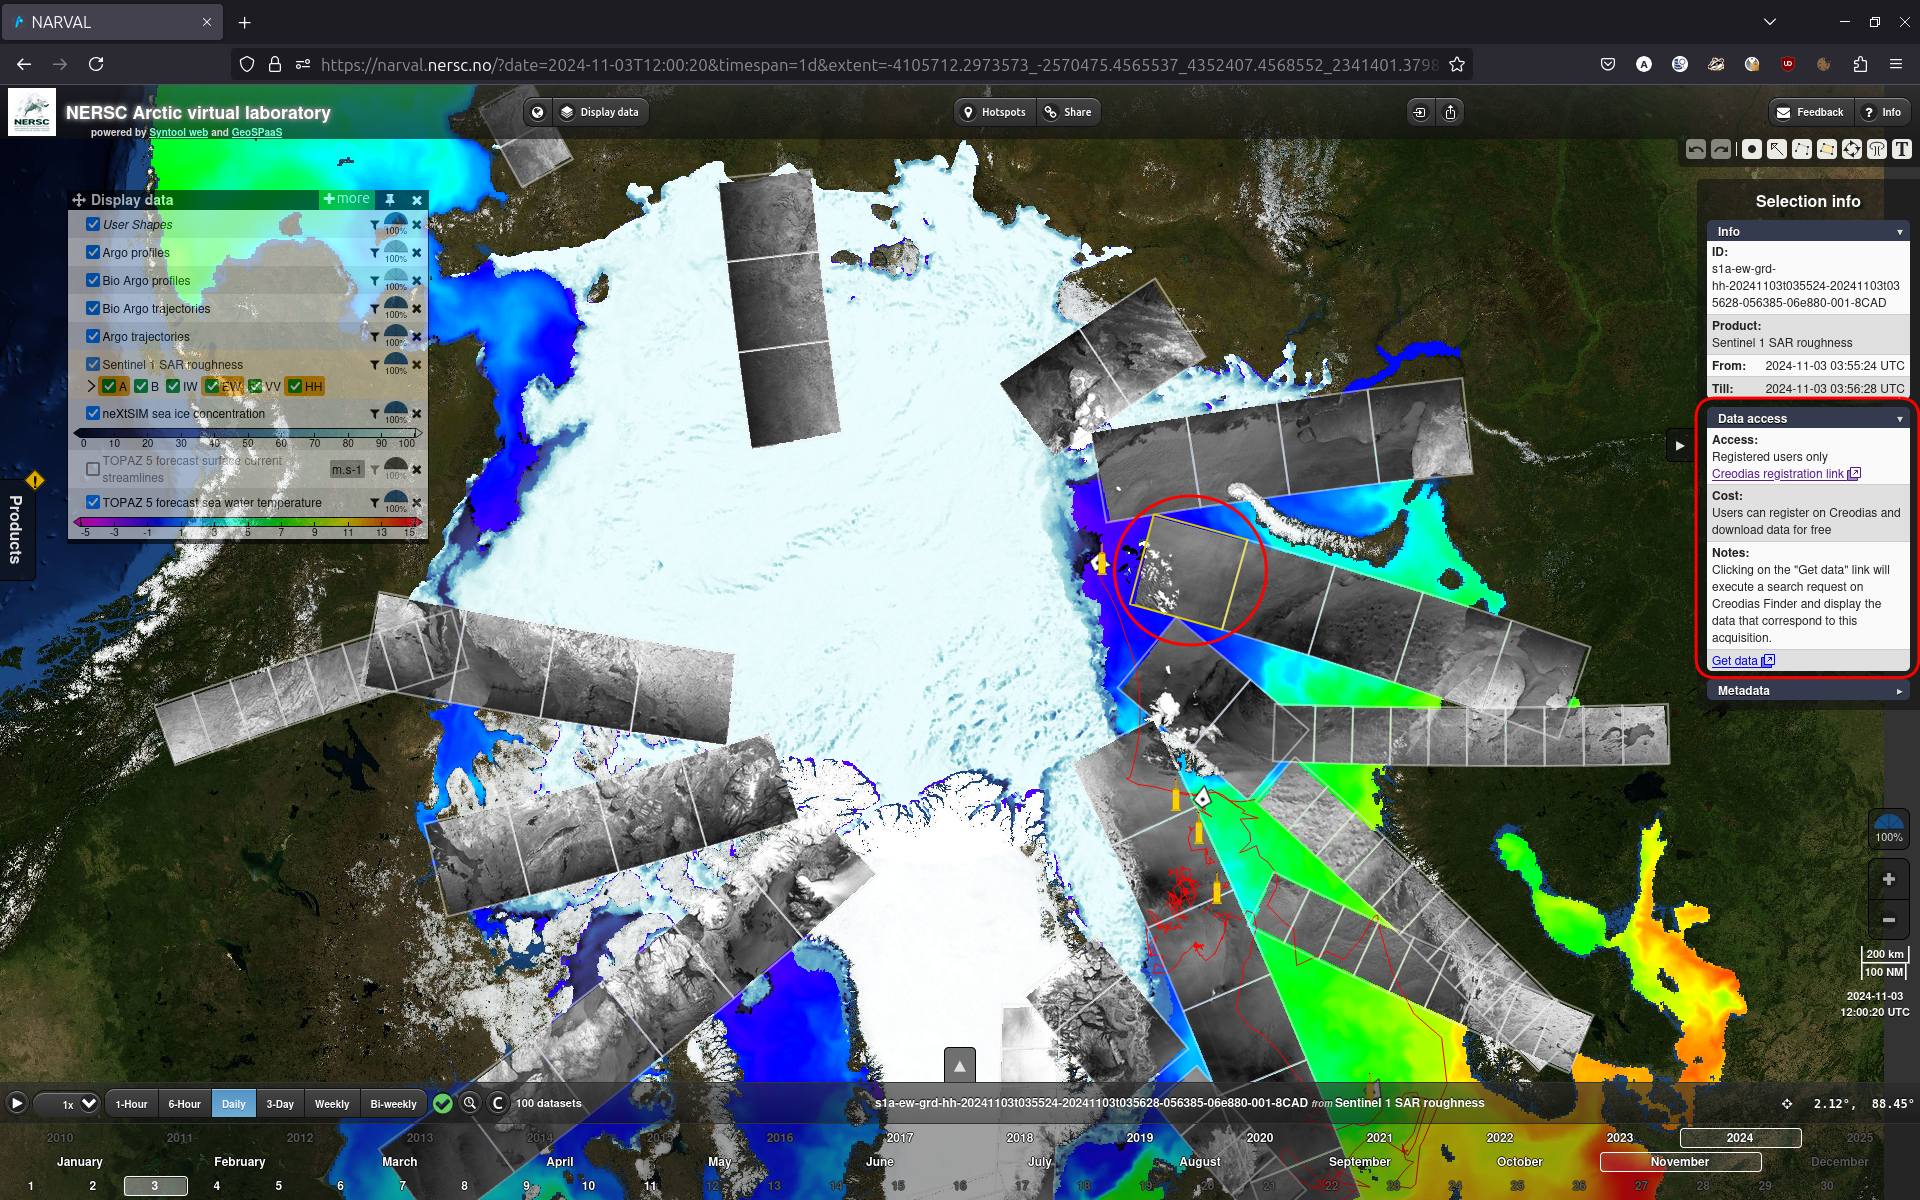
However, when clicking on a dataset on the map, the "Data access" section of the menu on the right side of the screen will provide a download link and any additional information needed (such as account creation on the data providers's website).
Background selection
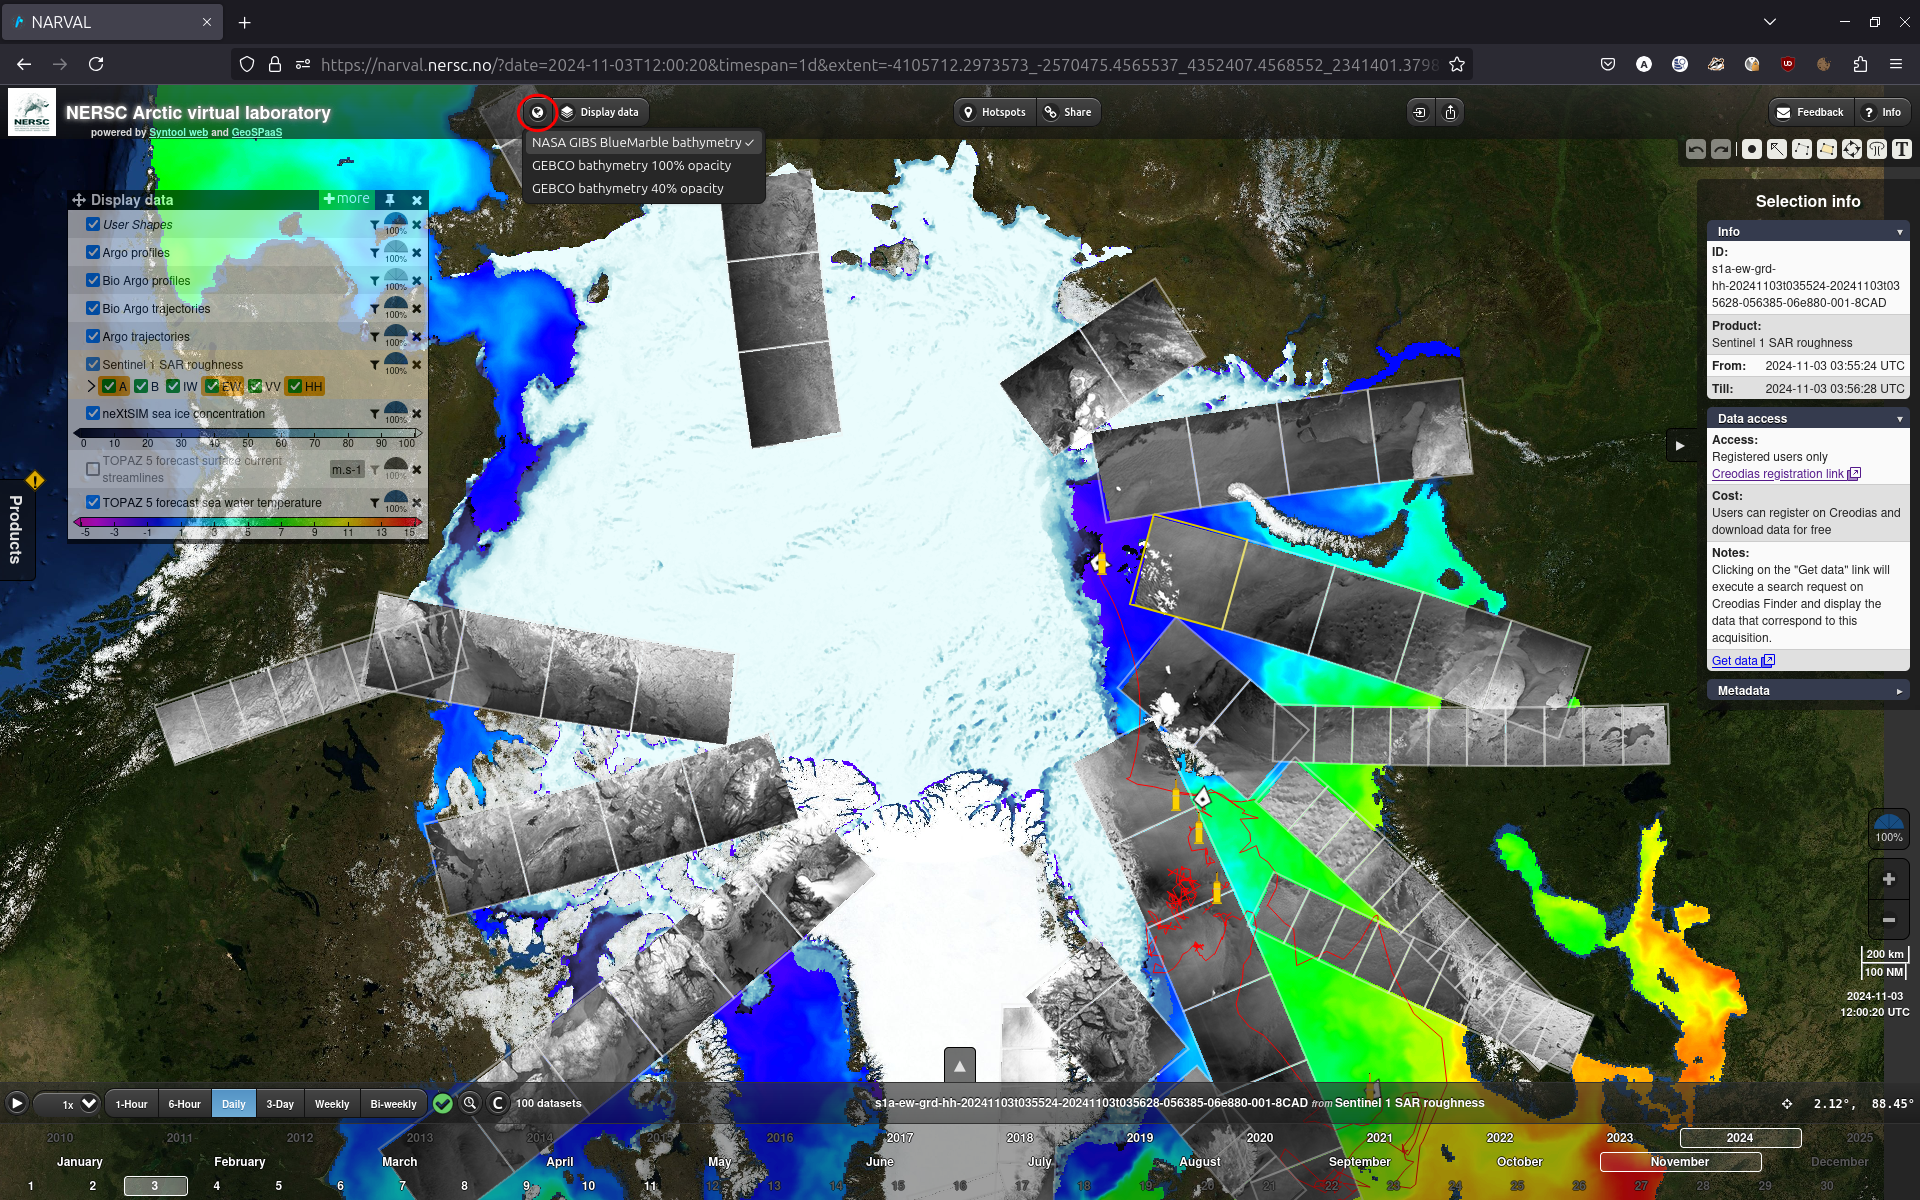
The background map can be changed using the button on the left of the "Display data" button at the top left of the screen.
Hotspots
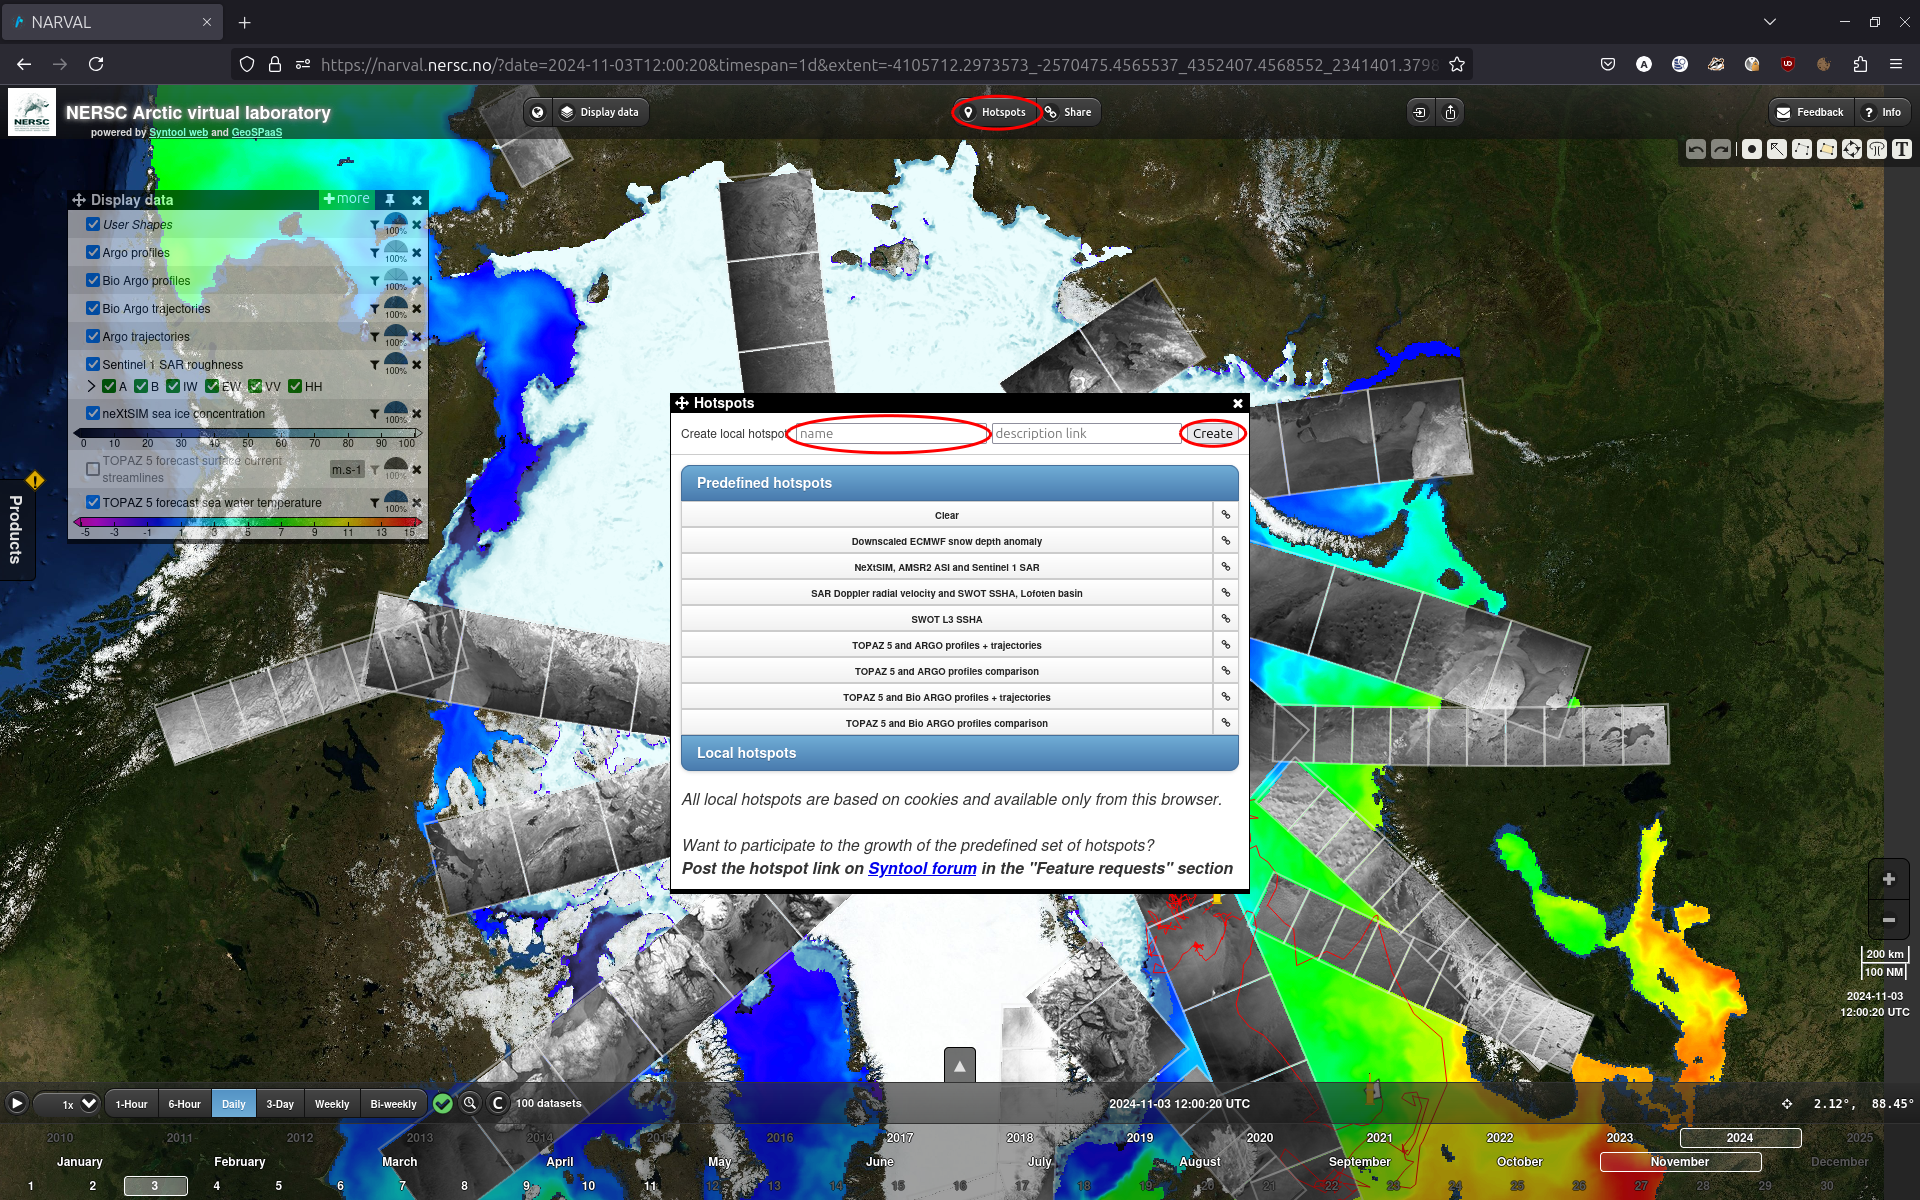
Hotspots allow to save the current view locally. The hotspot menu can be accessed through the "Hotspots" button at the top of the screen.
To create a local hotspot, just type in a name and an optional external link to a description and click "Create". The new hotspot will appear in the "Local hotspots" section and you can click on it at any time to recall the view at the time you created the hotspot.
